How it works
What each number means
These pictures are the calculator. Under each one is what you are looking at, and how it moves from year to year.
Open the calculator →What you type
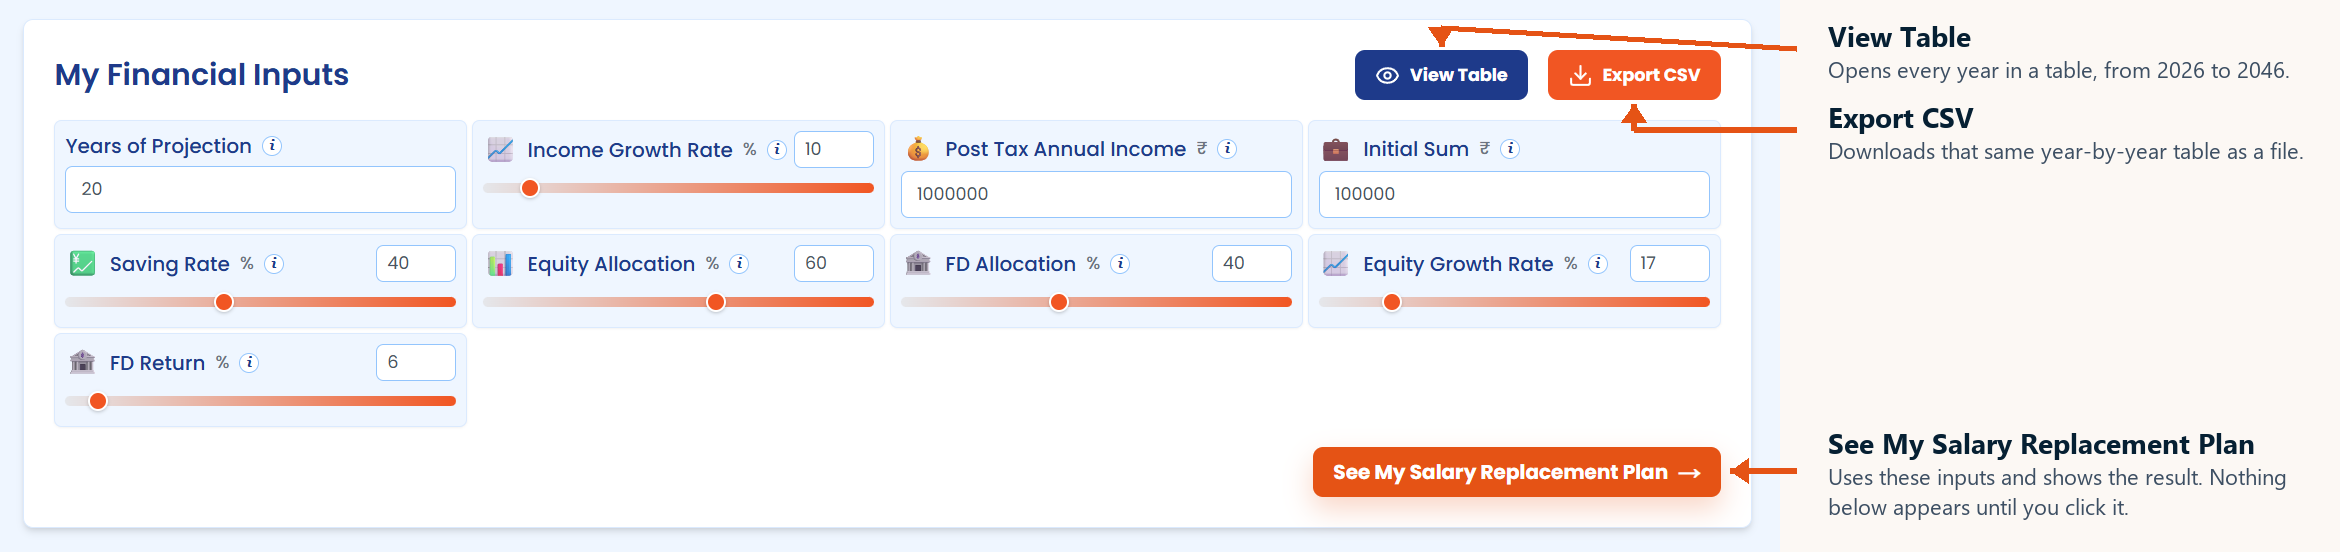
How to read this
- Start at the top left and move across each row.
- The number in the box is what you typed. The slider under it is the same number.
- Shares and FD should add up to 100.
- Nothing below this picture appears until you click the orange button.
Years of Projection — 20.How far ahead to look. The first year on the charts is 2026. The last year is 2046.
Income Growth Rate — 10%.Your salary becomes 10% bigger every year. That is why the orange salary line keeps climbing.
Post Tax Annual Income — 10,00,000.Salary for one year, after tax. This is the number the plan tries to replace.
Initial Sum — 1,00,000.Money already invested today, before any new savings are added.
Saving Rate — 40%.The share of salary you invest each year. In year one that is 4,00,000. As salary rises, this amount rises too.
Equity Allocation — 60%.Sixty percent of the invested money goes into shares.
FD Allocation — 40%.The other forty percent sits in a fixed deposit. The two shares add up to 100%.
Equity Growth Rate — 17%.The yearly growth you expect from shares. This is what makes the pile speed up in later years.
FD Return — 6%.The yearly interest you expect from the fixed deposit. Slower than shares, and steadier.
Orange button.Click See My Salary Replacement Plan. The pictures below stay hidden until you click it.
The first answer
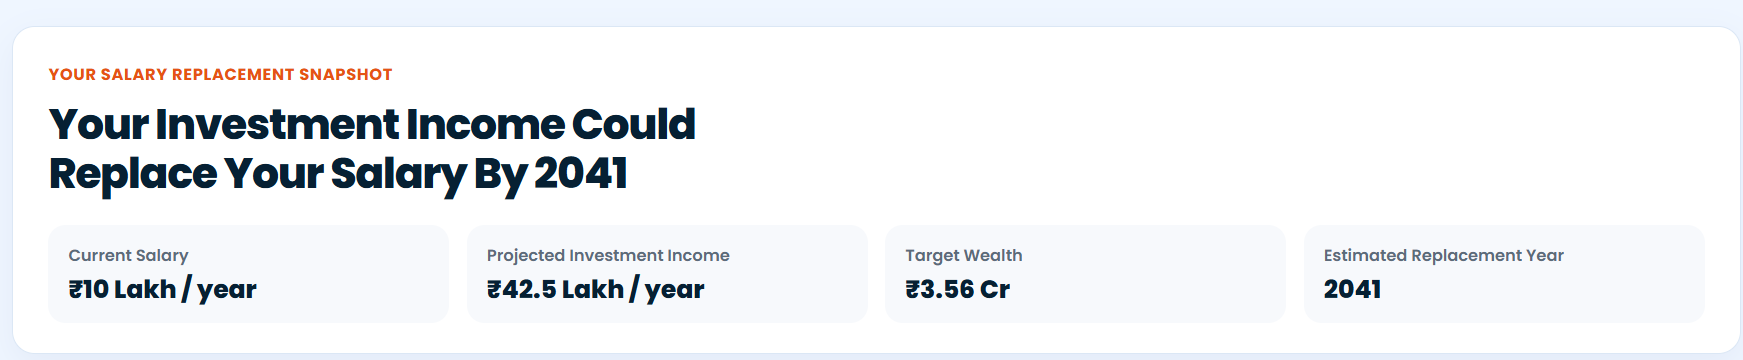
How to read this
- Read the big line first. That year is the answer.
- Then read the four boxes left to right.
- The first box is today’s salary. The next two are the income and the pile in that future year.
- The last box repeats the year so you do not have to hunt for it.
The heading — 2041.This is the year investment income can cover that year’s salary. Everything else in this box is about that moment.
Current Salary — 10 lakh a year.The salary you typed, written in short form. 10 lakh is 10,00,000.
Projected Investment Income — 42.5 lakh a year.What the investments can pay you in 2041. By then salary has also grown, and this income matches it.
Target Wealth — 3.56 crore.The full invested amount at that point, about 3,56,00,000. This is the pile, not the yearly income.
Estimated Replacement Year — 2041.The same year again, on its own, so you can see it without reading the heading.
The lines, year by year
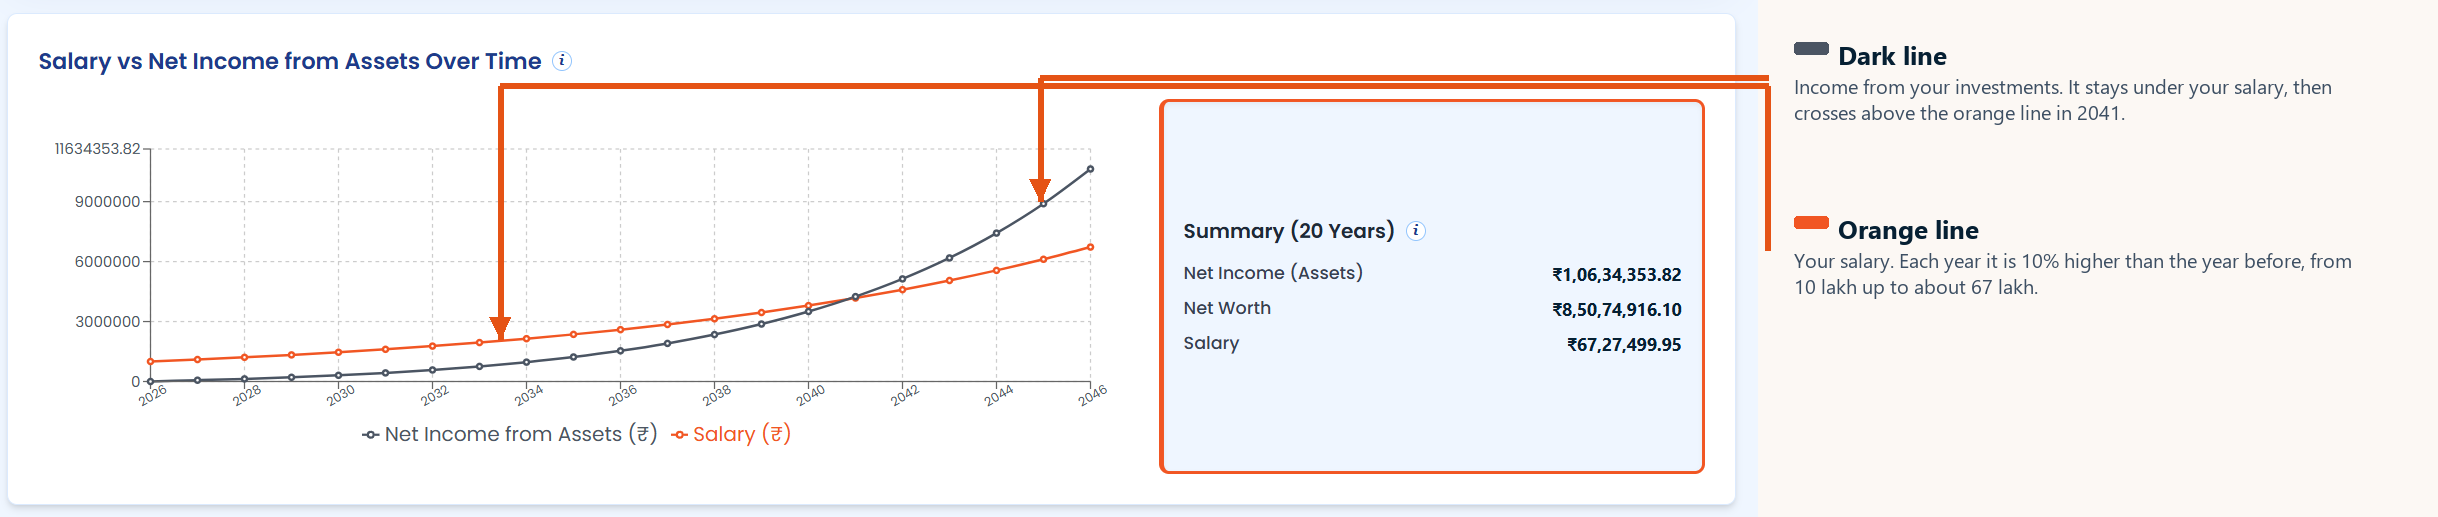
How to read this
- Time runs left to right. 2026 is the first dot. 2046 is the last.
- Go up from a year to see the amount. A higher dot means more money that year.
- Orange is salary. Dark is income from investments. Follow one colour across the years.
- The box on the right is only the last year, not every year on the line.
How to read the graph.Left is 2026. Right is 2046. Each dot is one year. The line joins those years.
Orange line is salary.It starts at 10,00,000 in 2026. Every next year is 10% more, so the line rises in a smooth curve.
A few orange dots.2027 is 11,00,000. 2028 is 12,10,000. 2036 is about 26 lakh. 2041 is 41,77,248. 2046 is 67,27,499.95.
Dark line is investment income.Money the investments pay you in that year. It starts near zero, stays under salary for a long time, then climbs faster.
They cross in 2041.That is the replacement year. After this, the dark line stays above the orange line.
The box is only 2046.Net income 1,06,34,353.82 is that year’s investment income. Net worth 8,50,74,916.10 is the full pile. Salary 67,27,499.95 is the last orange dot.
The two bar charts
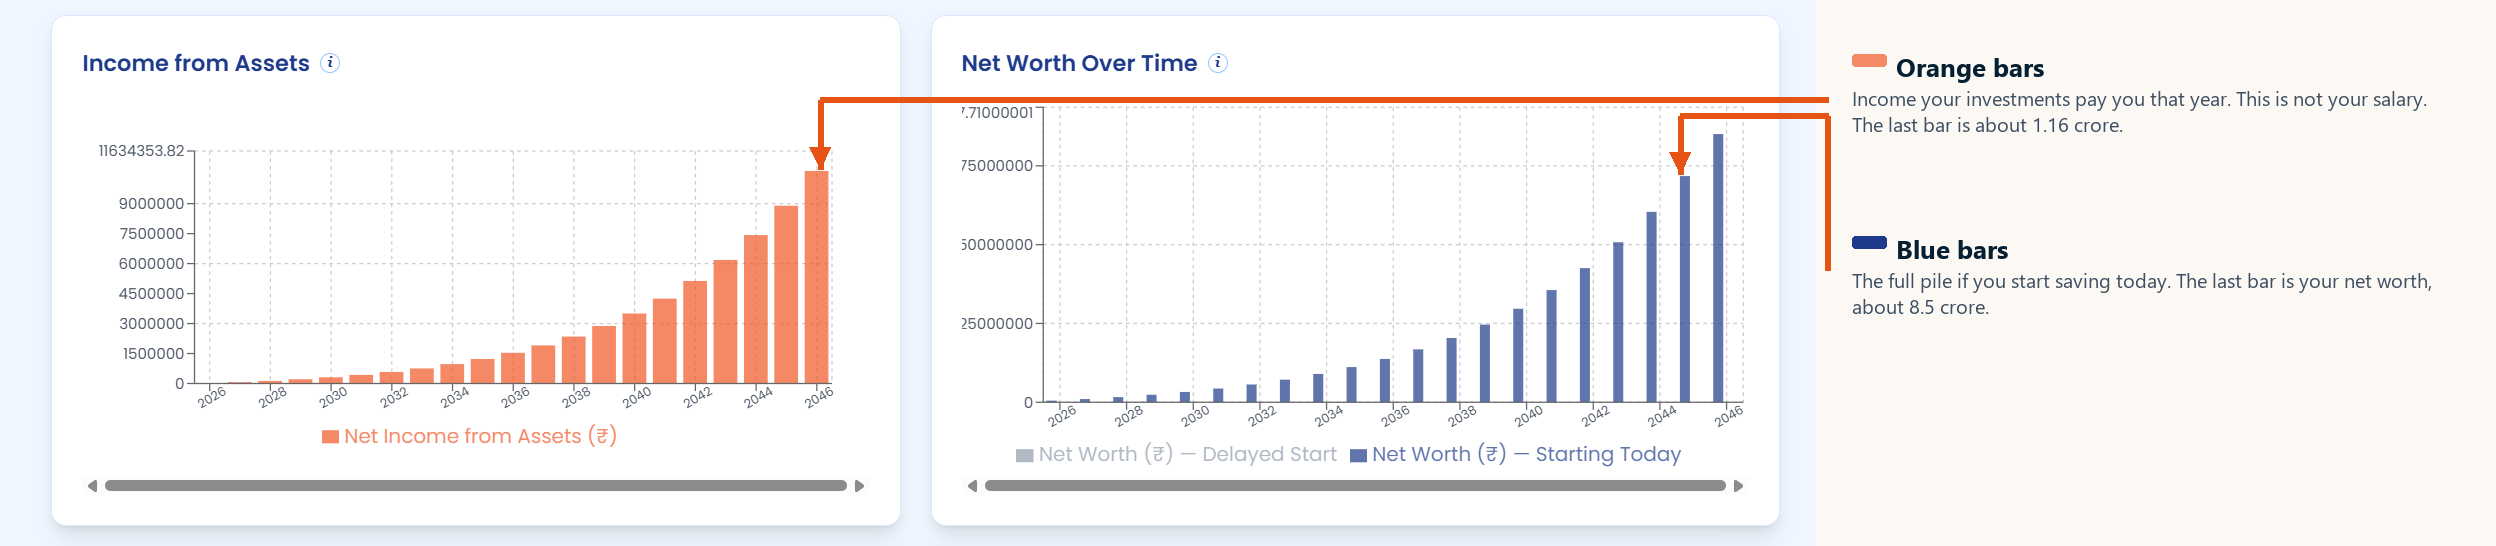
How to read this
- Both charts use the same years. Left bar is 2026. Right bar is 2046.
- A taller bar means a bigger amount in that year.
- Read the left chart as yearly income. Read the right chart as the full pile.
- Do not compare one orange bar with one blue bar. They are different kinds of money.
Same years, two different things.Both charts run from 2026 on the left to 2046 on the right. One bar is one year.
Orange bars are yearly income.This is not salary. It is what the investments earn that year. 2026 is a very short bar. Each later year is taller because the pile is bigger.
The last orange bar.In 2046 it reaches about 1.16 crore. That matches the net income in the summary box.
Blue bars are the full pile.Each bar is total invested money if you start saving today. Early bars are short. Later bars jump up as savings and growth stack.
The last blue bar.By 2046 the pile is about 8.5 crore. That is net worth, not the money you earn in one year.
What waiting costs

How to read this
- The small box is the number of years you wait. Change it, then click the orange button.
- The line under the button is the result. It appears only after the click.
- The rupee figure is the money you miss at the end, not the money you miss in one year.
The 5 in the box.How many years you wait before new savings start. The money already invested can still grow. New savings do not begin until those 5 years are over.
The orange button.Click Show My Cost of Delay. The result line appears only after that click.
2.74 crore.That is how much smaller the final pile is if you start 5 years late. The missed years never get a chance to compound.
Why it hurts later years more.The early years look small on the charts. Those same years are what make the tall bars at the end. Skip them, and 2046 ends lower.
One example, start now or wait
These sums use the same inputs as the pictures. Salary ₹10,00,000, growth 10%, saving rate 40%, money already invested ₹1,00,000, FD 40% at 6%, shares 60% at 17%. The first year is 2026.
Each year only the saved part of salary is invested. In 2026 that is ₹10,00,000 × 40% = ₹4,00,000. The other ₹6,00,000 stays as living money and never enters the portfolio.
The ₹4,00,000 is split by the two sliders. FD takes 40%, so ₹1,60,000 at 6%. Shares take 60%, so ₹2,40,000 at 17%. The ₹1,00,000 already invested is split the same way: ₹40,000 in FD and ₹60,000 in shares.
Money already in the portfolio earns a return this year. Money saved this year is added after that return, and it starts earning next year. On the chart, 2026 shows ₹0 of income from assets, because that first return stays inside the balance.
Start this year
2026 builds the pile from the opening money plus the first saving.
- FD starts at ₹40,000. After 6% it is ₹42,400. Add this year’s ₹1,60,000. FD ends at ₹2,02,400.
- Shares start at ₹60,000. After 17% they are ₹70,200. Add this year’s ₹2,40,000. Shares end at ₹3,10,200.
- 2026 net worth is ₹2,02,400 + ₹3,10,200 = ₹5,12,600. The ₹2,400 of FD return and the ₹10,200 of share return are inside that total.
Salary then grows 10%, so 2027 salary is ₹11,00,000. The ₹64,878 on the chart is a different number. It is the return on the 2026 ending pile.
- FD return: ₹2,02,400 × 6% = ₹12,144.
- Share return: ₹3,10,200 × 17% = ₹52,734.
- Income from assets in 2027: ₹12,144 + ₹52,734 = ₹64,878.
2027’s own saving is ₹11,00,000 × 40% = ₹4,40,000. FD receives ₹1,76,000 and shares receive ₹2,64,000. That ₹4,40,000 is added after the ₹64,878, so it starts earning in 2028.
- FD ends at ₹2,02,400 × 1.06 + ₹1,76,000 = ₹3,90,544.
- Shares end at ₹3,10,200 × 1.17 + ₹2,64,000 = ₹6,26,934.
- 2027 net worth is ₹3,90,544 + ₹6,26,934 = ₹10,17,478.
The same loop repeats. Salary grows 10% a year, 40% of it is saved, and that saving is split 40/60. Next year’s income is the return on this year’s ending balances: ₹3,90,544 × 6% plus ₹6,26,934 × 17%.
Wait 3 years
The picture above has 5 in the box. This walk-through uses 3, so every rupee is easy to check. Delay 3 means 2026, 2027 and 2028 still have a salary, and 40% of it could be saved, but that saving is not invested. Only the opening ₹1,00,000 keeps compounding. Investing starts in 2029.
During the wait the chart shows ₹0 of asset income. The return stays inside the balance.
- 2026. FD ₹40,000 × 1.06 = ₹42,400. Shares ₹60,000 × 1.17 = ₹70,200. Salary for the next year becomes ₹11,00,000.
- 2027. FD ₹42,400 × 1.06 = ₹44,944. Shares ₹70,200 × 1.17 = ₹82,134. Salary becomes ₹12,10,000.
- 2028. FD ₹44,944 × 1.06 = ₹47,640.64. Shares ₹82,134 × 1.17 = ₹96,096.78. Salary for 2029 is ₹13,31,000, which is ₹10,00,000 grown by 10% three times.
After those three years the pile is ₹47,640.64 + ₹96,096.78 = ₹1,43,737.42. Starting in 2026 would have reached ₹16,31,489.42 by the end of 2028, because a saving was added every year.
2029, the first year the saving is invested
Saving is ₹13,31,000 × 40% = ₹5,32,400. FD gets ₹2,12,960. Shares get ₹3,19,440. That new saving is added after this year’s return.
The delayed income is the return on the old pile only.
- FD: ₹47,640.64 × 6% = ₹2,858.44.
- Shares: ₹96,096.78 × 17% = ₹16,336.45.
- Delayed income in 2029: ₹2,858.44 + ₹16,336.45 = ₹19,194.89.
The line with no wait is ₹2,10,519.77 in the same year. By the end of 2028 that pile was ₹6,07,576.64 in FD and ₹10,23,912.78 in shares, because savings had been added since 2026. The 2029 return on it is ₹6,07,576.64 × 6% = ₹36,454.60, plus ₹10,23,912.78 × 17% = ₹1,74,065.17.
The gap in 2046
The summary box beside the lines is the last year if you never wait: income ₹1,06,34,353.82, net worth ₹8,50,74,916.10, salary ₹67,27,499.95. That box follows the path that starts in 2026.
With a 3-year wait the 2046 pile is ₹6,78,16,105.93. The gap is ₹8,50,74,916.10 − ₹6,78,16,105.93 = ₹1,72,58,810.17. The three years of saving that never got invested keep missing their return for the remaining 17 years, so the delayed line stays lower.
Taking money out
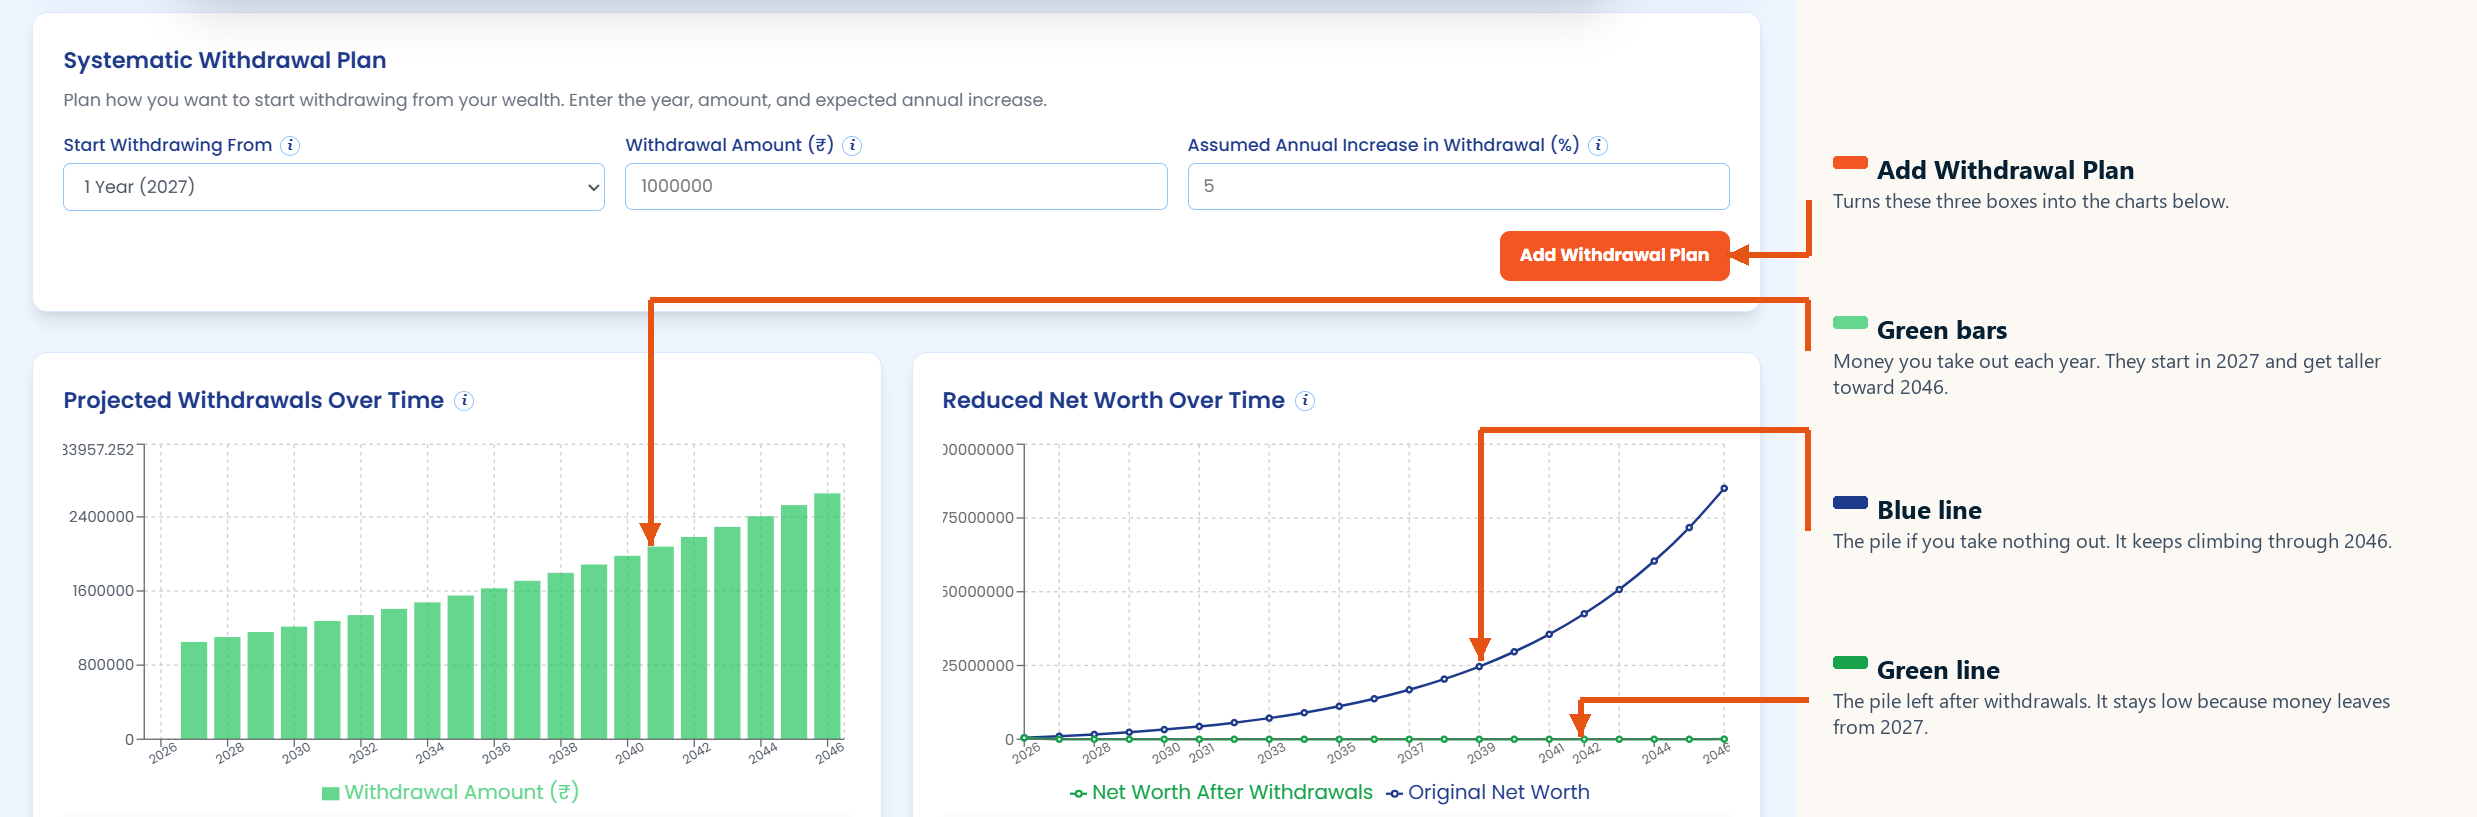
How to read this
- Read the three boxes first. They are the year, the amount, and how fast that amount grows.
- Then read the charts left to right, from 2026 to 2046.
- Green bars are money leaving each year. Taller means you take out more.
- On the right chart, blue is the pile if you take nothing. Green is the pile after you take money out.
Start year — 2027.The year you begin taking money out. In this picture that is the first year of the plan, not 2041.
Amount — 10,00,000.How much you take out in a year. The 5% box makes that amount a little bigger every following year.
Green bars, left to right.Each bar is one year. They start as soon as withdrawals begin, then get taller because of the 5% rise. 2046 is the tallest bar.
Blue line.Total money if you never take anything out. It climbs the whole way to 2046.
Green line.Money left after those withdrawals. It stays near the bottom here because money starts leaving in 2027, before the pile has had time to grow.
Change any input and click the button again. The year and the amounts move with it. These figures are an estimate from the numbers you type.